USA Today recently reported that gas prices are the most expensive in US history, breaking the record from 2008. The U.S. Energy Information Administration notes that the average price of a gallon of gasoline reached $4.22 this past month, the highest nominal price ever and 16 cents higher than the previous record of $4.06 in July of 2008.
But does the nominal money price really reveal the true price? Since we buy things with money, but we pay for them with our time, there are actually two prices: money prices and time prices. Money prices are expressed in dollars and cents while time prices are expressed in hours and minutes. Converting a money price to a time price is simple. Divide the money price of a product or service by hourly income. As long as hourly income is increasing faster than money prices, the time price will be decreasing.
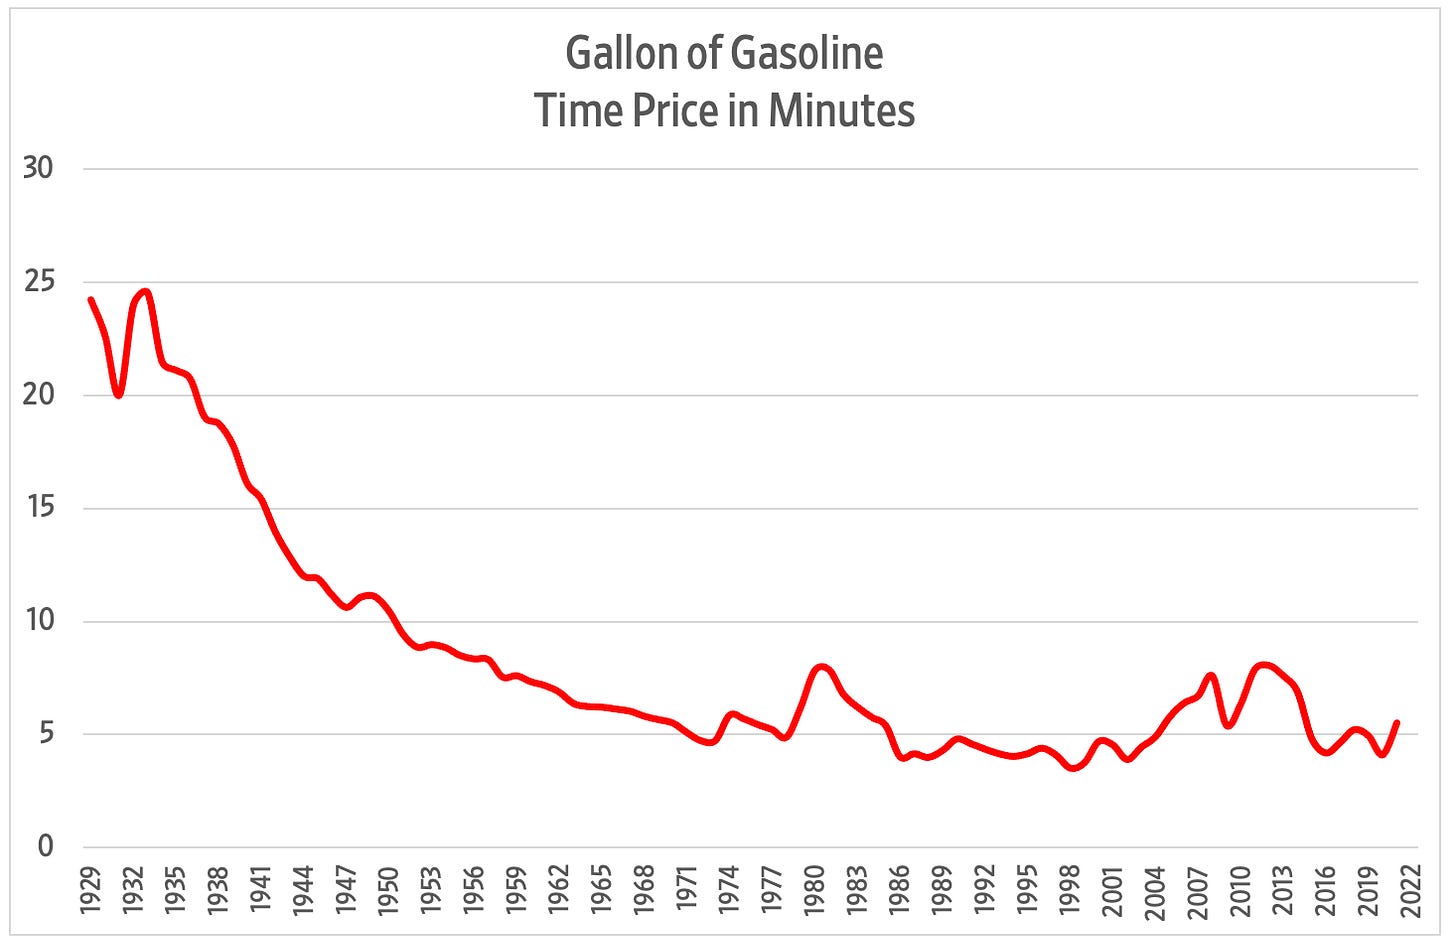
To calculate the time price of a gallon of gasoline we divided the nominal money price by nominal blue-collar hourly compensation (wages and benefits) as reported by the economic data website measuringworth.com. When we look at the time price of a gallon of gasoline, we see a much different story.
In 1929 it took about 24 minutes of time to earn the money to buy one gallon of gasoline. Today the time price is closer to 6 minutes. The time price of gasoline has dropped by 75 percent. For the time it took to earn the money to buy one gallon in 1929, you get four gallons today. Gasoline abundance has increased by 300 percent. This occurred while global population increased 290 percent from 2 billion to 7.8 billion today. The greater the population, the more abundanant gasoline has become.
Another interesting way to think about the time price of a resource is to consider how many gallons of gasoline one hour of time would buy. Call this gallons per hour or GPH. This ratio reveals how much abundance is changing over time.
In 1929 one hour of time would get you around 2.5 gallons. By 1973 gasoline abundance had increased 410 percent to 12.75 gallons per hour. Then the OPEC cartel showed up and raised prices dramatically. By 1981 one hour would only get you 7.63 gallons. But then OPEC lost its control and the trend reversed. By 1998 gallons per hour was up to 17.15, the highest rate on record. World events reversed the trend again and by 2012 we were back down to 7.46 gallons per hour, lower than 1981. We then climbed out of this trough and were back up to 14.66 GPH in 2020. COVID policies have knocked us off course over the last two years, but the underlying fundamentals suggest we will recover and move back to around 12 gallons per hour, the average over the last 50 years.
If you found this essay valuable and interesting, please share it with your friends.
You can learn more about these ideas in our forthcoming book, Superabundance, available for pre-order at Amazon.
Gale Pooley is a Senior Fellow at the Discovery Institute and a board member at Human Progress


Share this post