


Think pizzas. Personal resource abundance is the size of the slice. Global resource abundance is the size of the pie. Global resource abundance is the product of the size of the slice multiplied by the size of the population.
Comparing global resource abundance over time is easy with a simple chart. Plot personal resource abundance on the vertical axis and population on the horizontal axis. Select a start year point and set both dimensions to a value of one. This will give you a one-by-one box equal to one. Then consider the end year point of the analysis and compare the two.
Let’s analyze bananas. If the time price of bananas decreases by 75 percent over 40 years, it means you now get four bananas for the time it used to take to only get one banana. Personal banana abundance has gone from one to four on the vertical axis, increasing by 300 percent.
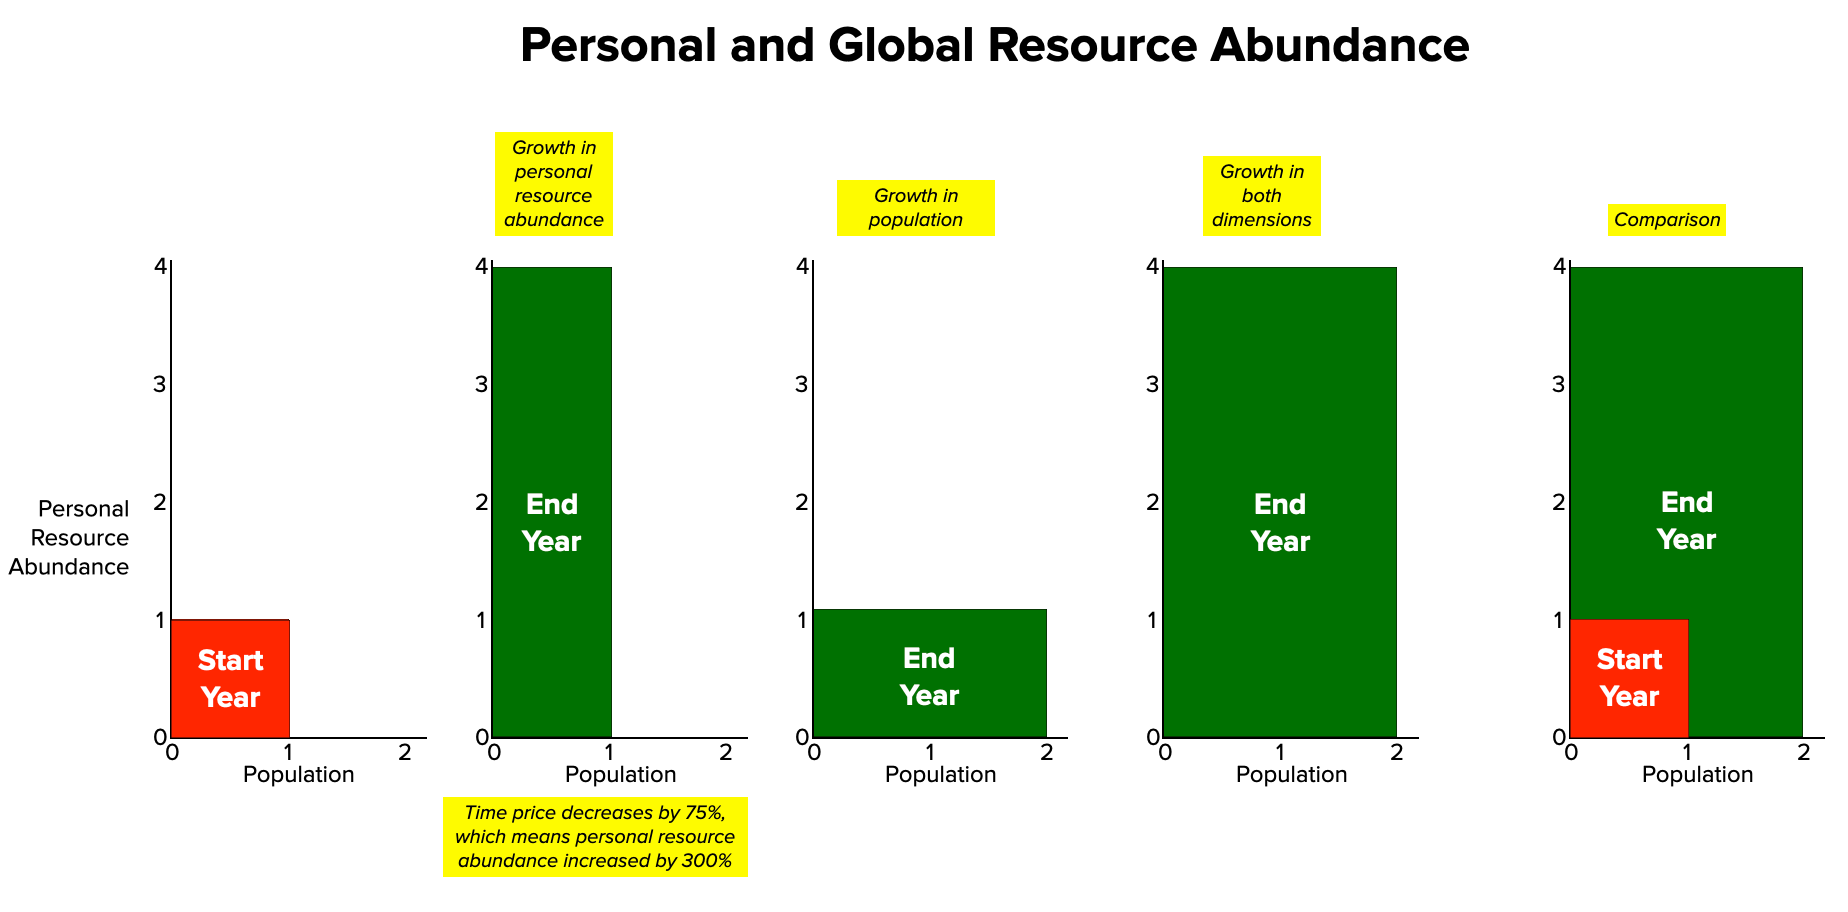
What if population doubled over this same period? The horizontal axis would grow 100 percent from a value of one to a value of two. The end year box would now measure four by two or eight. Now place the start year box over the end year box. See the difference? Global abundance has increased 700 percent from one to eight.

Thinking Deeper
Over this 40-year period personal banana abundance increased from one to four. This would indicate a 3.53 compound annual growth rate. At the same time global banana abundance increased from one to eight, indicating a 5.33 percent annual rate. At this rate, global banana abundance doubles every 13 years.
Elasticity
In economics we use the term “elasticity” to describe the change in one variable compared to another. At the personal level, as population increased by 100 percent, banana abundance increased by 300 percent. Every one percent increase in population corresponded to a three percent increase in personal banana abundance. At the global level, as population increased by 100 percent, banana abundance increased by 700 percent. Every one percent increase in population corresponded to a seven percent increase in global banana abundance.
This is a simple way to measure and visualize personal and global abundance. If you found this essay valuable and interesting, please share it with your friends.
You can learn more about these ideas in our forthcoming book, Superabundance, available for pre-order at Amazon.

Gale Pooley is a Senior Fellow at the Discovery Institute and a board member at Human Progress


Share this post