Get 9.6 Percent More Thanksgiving Dinner This Year Compared To A Year Ago
Be thankful for humanity's increasing in knowledge in transforming atoms into valuable resources.
Since 1986 the American Farm Bureau Federation (AFBF) has conducted an annual price survey of food items found in a typical Thanksgiving Day dinner. The items on this shopping list are intended to feed a group of 10 people, with plenty of leftovers remaining. The list includes a turkey, a pumpkin pie mix, milk, vegetable tray, bread rolls, pie shells, green peas, fresh cranberries, whipping cream, cubed stuffing, sweet potatoes, and several miscellaneous ingredients.
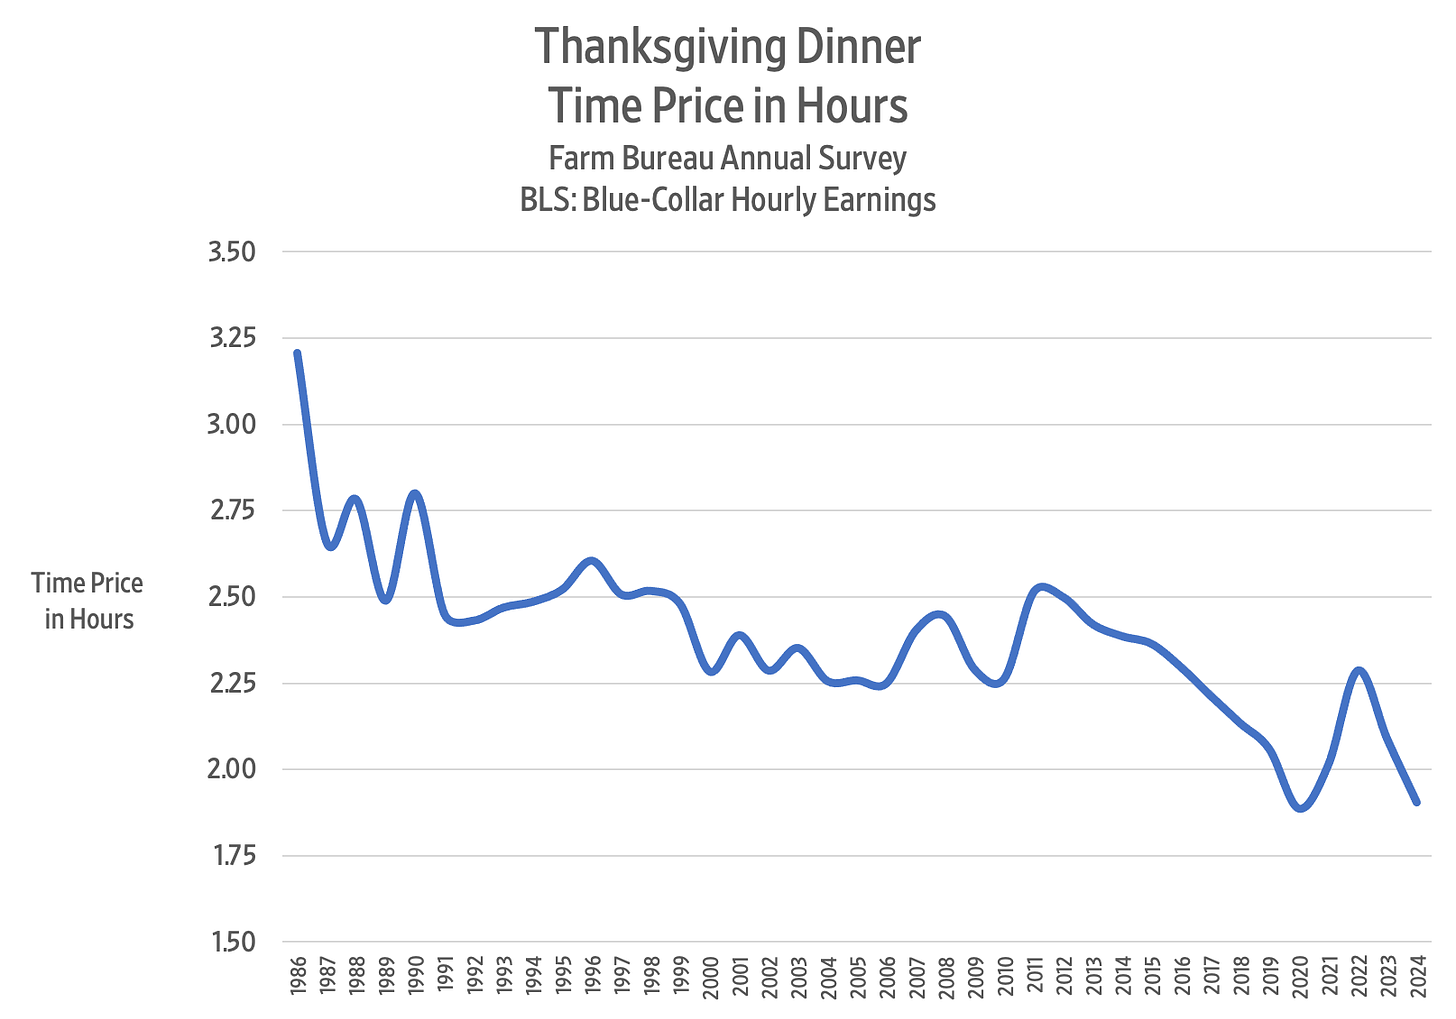
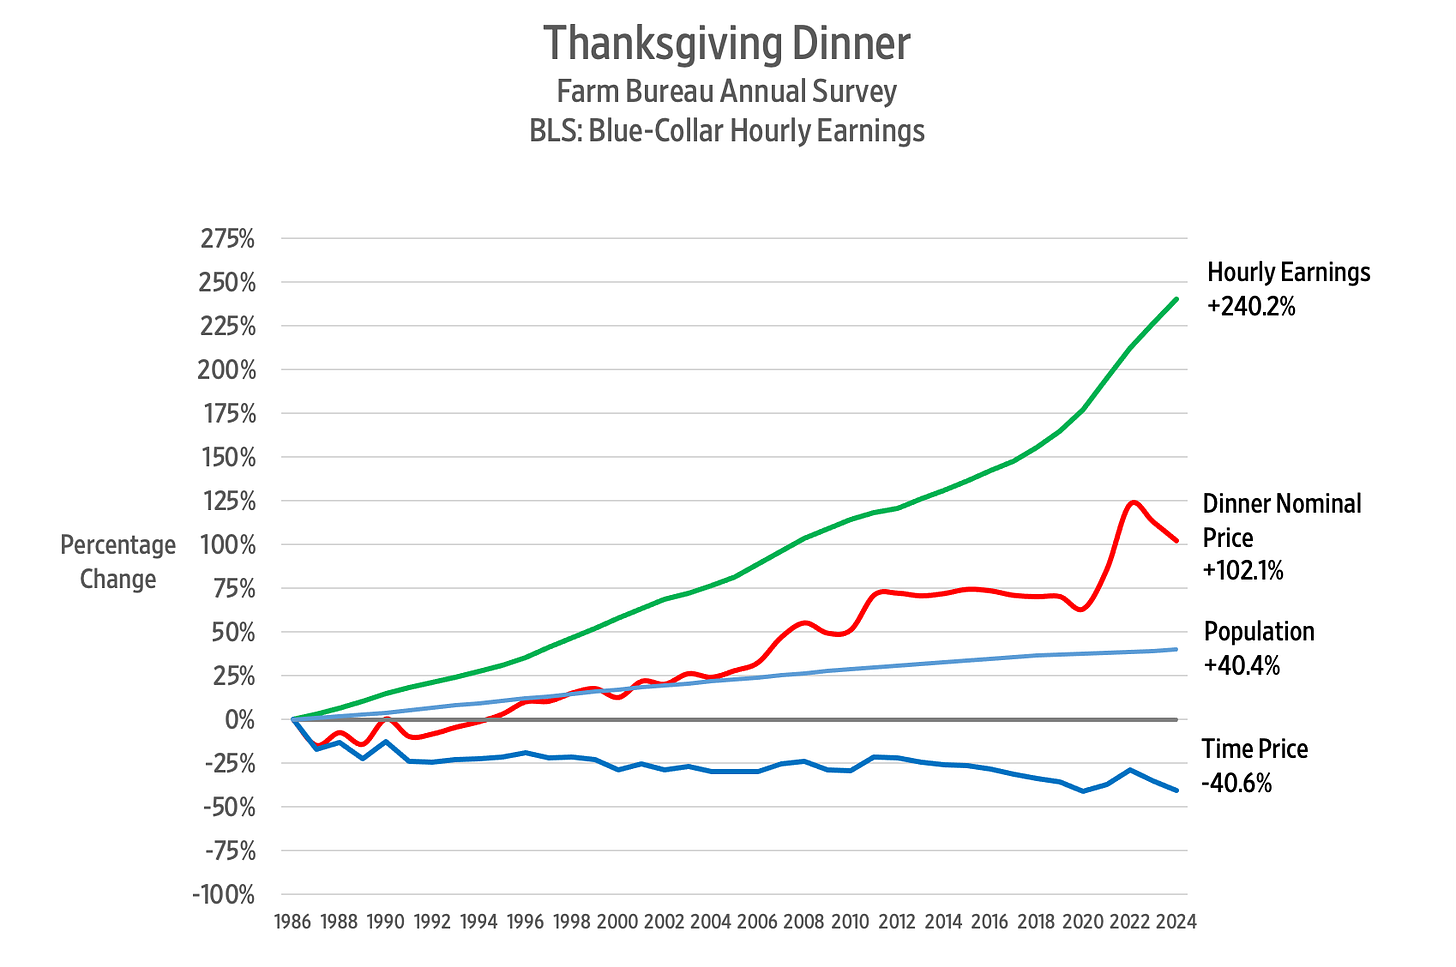
So what has happened to the price of a Thanksgiving Day dinner over the past 38 years? The AFBF reports that in nominal terms, the cost rose from $28.74 in 1986 to $58.08 in 2024, or an increase of 102.1 percent. Since we buy things with money but pay for them with time we should analyze the cost of a Thanksgiving Day dinner using Time Prices. To calculate the Time Price we divide the nominal price of the meal by the nominal wage rate. That gives us the number of work hours required to earn enough money to feed those 10 guests. According to the Bureau of Labor Statistics, the blue-collar hourly wage rate increased by 240.2 percent from $8.96 per hour in October of 1986 to $30.48 in October of 2024. Remember that when wages are increasing faster than prices, time prices are decreasing. From 1986 to 2024 the time price of the AFBF Thanksgiving dinner for a blue-collar worker declined from 3.2 hours to 1.9 hours, or 40.6 percent. This means that blue-collar workers can buy 16.8 Thanksgiving Day dinners in 2024 for the same number of hours it took to buy 10 in 1986. We can say that thanksgiving dinners have become 68 percent more abundant since 1986. Here is a chart showing the time price trend for the AFBF Thanksgiving dinner the last 38 years:
The lowest time price for the AFBF Thanksgiving dinner was 1.87 hours in 2020 but then COVID policies struck and it jumped up to 2.29 hours in 2022. Last year the time price was 2.09 hours compared to 1.91 hours this year, a decrease of 8.8 percent. For the time it took to buy Thanksgiving dinner last year you get 9.6 percent more food this year.
From 1986 to 2024 the U.S. population rose 40.4 percent from 240 million to 337 million. During this same period the Thanksgiving dinner time price decreased by 40.6 percent. Each percent increase in population corresponded to a one percent decrease in the time price.
To get a sense of the relationship between food prices and population growth imagine providing a Thanksgiving Day dinner for everyone in the United States. Recall that the U.S. population rose 40.4 percent from 240 million in 1986 to 337 million in 2024. What happened to the total Thanksgiving Day dinner bill over that 38-year period? If the whole of the United States consisted of blue-collar workers in 1986 the total Thanksgiving dinner time price would have been 77 million hours. Remarkably, by 2024 this time price fell to 64.2 million hours, a decline of 12.8 million hours or 16.6 percent. The total Thanksgiving Day dinner bill in the United States fell 16.6 percent at the same time population increased by 40.4 percent. We call this economic phenomenon superabundance. More people are making things much more abundant.
Please consider enjoying our new course on the Economics of Human Flourishing at the Peterson Academy.
We explain and give hundreds of examples why more people with freedom means much more resource abundances for everyone in our book, Superabundance, available at Amazon.
Gale Pooley is a Senior Fellow at the Discovery Institute and a board member at Human Progress.


Thank you, Gale.
We must always remember that we become rich in two ways. The obvious way is by increasing our incomes and this seems to be the focus of the public.
The latter way, however, is more important, by compressing the cost of goods and service.
Most things are getting cheaper through the magic of material progress and knowledge.